|
Question: What's new in Foxhound 2.0?
Answer:
New Feature: AutoDrop
[Top]
The AutoDrop process is available in the Extended Edition of Foxhound Version 2.
AutoDrop works like Alerts; with AutoDrop you specify the conditions which will cause Foxhound to automatically drop a connection:
-
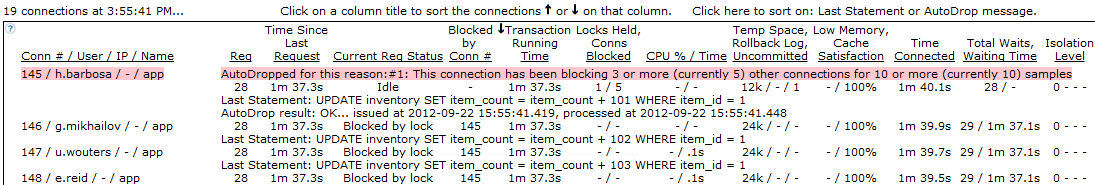
AutoDrop #1 - Blocking others - Automatically drop each connection that has been blocking [5] or more other connections for [10] or more recent samples.
-
AutoDrop #2 - Blocked by other - Automatically drop each connection that has been blocked by another connection for [10] or more recent samples.
-
AutoDrop #3 - Long transaction - Automatically drop each connection with a transaction that has been running for [10m] or longer.
-
AutoDrop #4 - Temp file usage - Automatically drop each connection that uses [512M] or more of temporary file space for [10] or more recent samples.
-
AutoDrop #5 - CPU usage - Automatically drop each connection that uses [25]% or more of approximate CPU time for [10] or more recent samples.
-
AutoDrop #6 - Locks - Automatically drop each connection that has [1,000,000] or more locks for [10] or more recent samples.
Like Alerts, AutoDrop notices appear on the Monitor and History pages and they can be sent by email.
Unlike Alerts, connections that have been autodropped are highlighted in the current connections section of the Monitor and History pages:
Also, the Do-Not-AutoDrop lists let you specify which important user ids and connection names are to be excluded from the AutoDrop process.
The AutoDrop process is available for target databases running on SQL Anywhere Version 9 and above.
New Feature: Schedules
[Top]
The Schedules feature is available in the Extended Edition of Foxhound Version 2.
Schedules let you tell the Foxhound Database Monitor when to turn various processes on and off.
Schedules are entered as one string for each day and one character for each 15-minute period with Ys and dots representing "on" and "off":
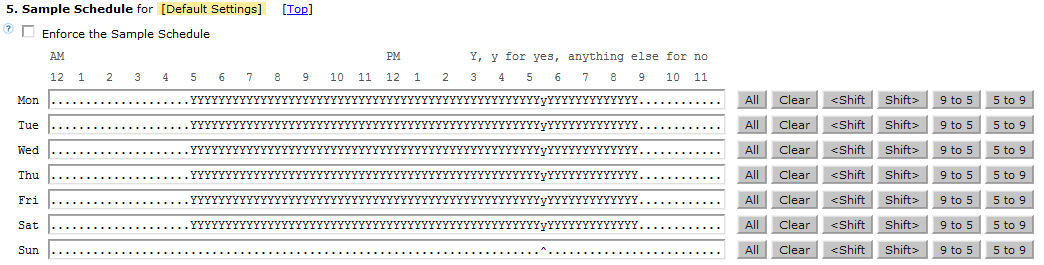
The Sample Schedule controls everything: it specifies when the entire Foxhound Monitor process is turned on and off.
For example, you might turn sampling off during regularly-scheduled outages or periods of complete inactivity.
When the Monitor is running, three other schedules can be used to fine-tune Foxhound processing:
-
The Connection Sample Schedule turns the gathering of connection-level sample detail on and off.
For example, you might be interested in database availability on a 24-hour basis, but not detailed
information about all the connections in a large pool during the overnight hours. Depending on the number
of connections and the schedule settings, the Connection Sample Schedule can dramatically reduce the growth
of the Foxhound database.
-
The Alert Email Schedule turns Alert emails on and off. For example, Alerts may only be important enough for
emails to be sent during certain hours of the day and/or days of the week.
-
The AutoDrop Schedule turns the AutoDrop process on and off. For example, off-peak periods may be set aside
for processes that might cause blocking and other problems if they were run during peak periods.
New Feature: Jumping Through History
[Top]
The Jumping Through History feature is available in all editions of Foxhound Version 2.
The new Go to: jump on the History menu lets you scroll the display directly to a date/time to see what was going on in your database back then. You don't have to be exact when entering the date/time, Foxhound will scroll to the nearest recorded sample.
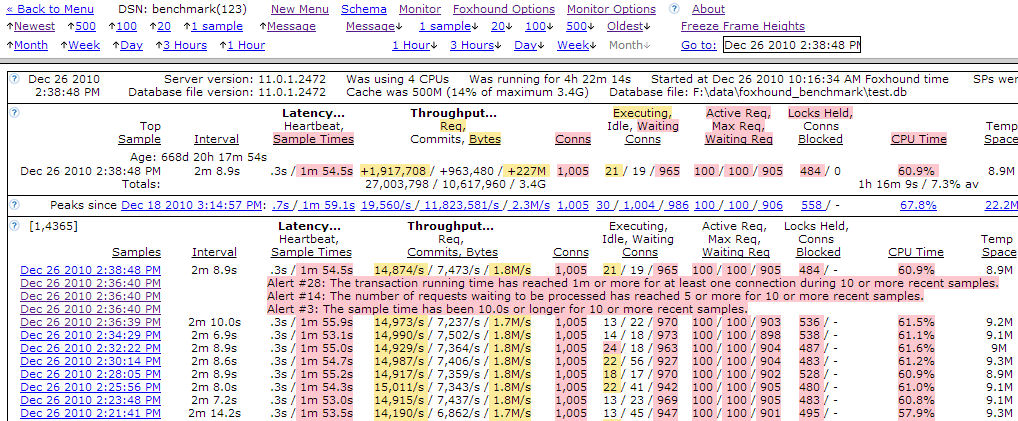
After doing a direct Go to: jump, you can change the value to get closer, or use the relative menu items to scroll up and down by 1 sample, or 100 samples, or an hour, a day, a week.
The new up and down Message jumps let you skip over all the intervening samples to reach the previous or next Alert message, AutoDrop Notice or "Database stopped" message, or any of the other special actions or unusual circumstances encountered during the monitoring process.
Enhancements...
[Top]
Enhancement: Monitor Tab Shows More Data In Less Space
[Top]
The list of target databases on the Monitor tab of the Foxhound Menu page has been redesigned to reduce
the amount of horizontal and vertical scrolling required when you are monitoring a lot of databases.
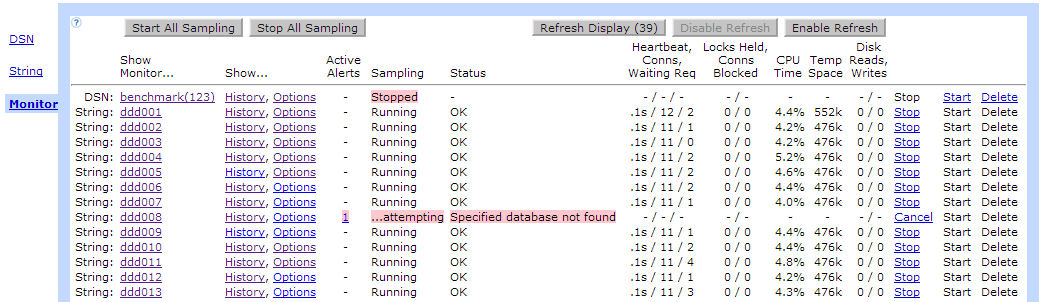
At the same time, the full text of any error messages is now shown in the "Status" column, with wrapping enabled,
rather than truncating the text.
Enhancement: Up and Down Arrows On The History Menu
[Top]
The new  and
and  arrows are better than the old left � and right � arrow characters didn't match the up and down scrolling actions.

Enhancement: Latency and Throughput Highlighted
[Top]
The columns on the Monitor and History pages have been rearranged to highlight the Latency and Throughput numbers:
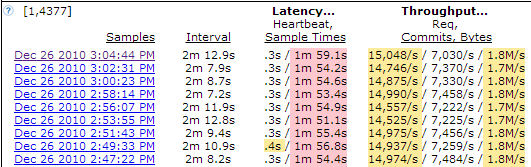
The separate Bytes In and Bytes Out numbers are still shown at the connection level, but they are aggregated at the
database level as one of the Throughput numbers.
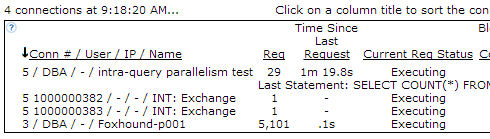
Enhancement: Connection Identification Columns Rearranged
[Top]
The four columns which identify each connection have been rearranged to put the connection number first: Conn # / User / IP / Name
Also, for target databases running on SQL Anywhere 12 and later, "INT:" internal connection
numbers are sorted by their parent connection numbers.
Here's an example showing how two "INT: Exchange" connections are used
to implement intra-query parallelism:
Enhancement: Email Status Displayed In Alert Messages
[Top]
Alert messages include the email status on the Monitor and History displays, and on the Active Alerts section of Foxhound Menu Monitor Tab.
Also, the adhoc view rroad_alert_union now includes the email_status column.
Email sent OK.
Email failed with return code xxx.
Email not sent because emails were disabled.
Email not sent because of the Alert Email Schedule.
Email sent, status unknown.
Enhancement: Initial 'Last Statement:' Sort Order Changed To DESC
[Top]
The initial sort order when you first click on the 'Last Statement:' title text in the current connection list
in the Monitor and History pages has been changed from ASC to DESC so non-empty values appear at the top of the list.
Enhancement: Click here to sort on: Last Statement or AutoDrop message
[Top]
When there are a lot of connections showing on the Monitor or History pages, the column titles
"Last Statement" and "AutoDropped" might not appear on screen so there's nothing to click on if
you want to sort those values to the top. This has been fixed by adding clickable text to the
connection section heading: "Click here to sort on: Last Statement or AutoDrop message."
Enhancement: Tip "Click on a column title to sort the connections ..."
[Top]
The Monitor and History pages now display this tip at the top of the list of current connections: "Click on a column title to sort the connections ..."
Enhancement: New Design For The Foxhound And Monitor Options Pages
[Top]
The Foxhound Options and Monitor Options pages have both been redesigned to be easier to use.
Enhancement: Color Highlighting For "[Default Options]" On The Monitor Options Page
[Top]
The "[Default Options]" title is color highlighted on the Monitor Options page to help prevent the
common error of making changes to the default settings rather than the options for a specific target database.
Enhancement: More Buttons Automatically Save Your Changes
[Top]
The following buttons on the Monitor Options page now automatically save any changes you have made to fields on the
screen before performing the button's primary action. Previously, you had to remember to click on one of the other "Save" buttons first.
Save Settings As Default
Save the currently displayed settings for "DSN: xxx", then copy and save them into the [Default Settings].
Force Default Settings on All Targets
Save the currently displayed [Default Settings], then copy and save them onto all other target databases.
Enhancement: Alert #27 Connection CPU Criteria Improved
[Top]
The connection-level CPU time percentage used by the Alert #27 processing has been changed to be the percentage
of overall CPU time available, rather than the percentage of clock on the wall time. The new technique has also
been used in the new AutoDrop #5 processing.
Alert #27 Connection CPU: The approximate CPU time has been [x]% or higher for at least one connection during [y] or more recent samples.
AutoDrop #5 CPU usage: Automatically drop each connection that uses [x]% or more of approximate CPU time for [y] or more samples.
This change affects target servers using multiple CPUs. For example, if SQL Anywhere was using 8 processors, and
one connection used 8 seconds of CPU time in a 10-second interval, that would be
8 seconds / 10 seconds) / (8 processors in total) * 100 = 10% of the total available CPU time
Previously 80% was the figure used when processing Alert #27.
Enhancement: Database Options Page Shows The Full Set
[Top]
The Display Schema - Options page now shows the full set of target database options in the lower section of the display.
This will make it easier to copy-and-paste all the option settings for documentation and comparison purposes.
Previously, only the options currently containing the original default values were shown in the lower section.
Enhancement: Improved Error Checking In Startup Scripts
[Top]
Improved error checking has been added to the "Start Foxhound via..." shortcuts to diagnose problems with
the FOXHOUND2 and SQLANY12 environment variables and the SQL Anywhere 12 installation.
Enhancement: Refresh Diagnostics Display
[Top]
A "Refresh Display" button has been added to the Diagnostics section of the Foxhound Options page. This is more
convenient than the browser refresh button which sometimes prompts for confirmation, and then scrolls back to the top.
Enhancement: Google Mail Certificate File Included
[Top]
A copy of the SSL certificate file currently used by smtp.gmail.com has been included with Foxhound.
For a standard installation on Windows 7, specify the following in Foxhound Options - SMTP Certificate Filespec:
C:\ProgramData\RisingRoad\Foxhound1\Equifax_Secure_Certificate_Authority.cer
Enhancement: New Design For The Activation Page
[Top]
All the new kinds of registration keys available with Version 2 made a new design necessary
for the Foxhound Activation page.
Gone are the detailed "Step 1, Step 2, Step 3" instructions,
replaced by a simple "pick this key and press that button" process
with "What is ... ?" links to help you pick the right kind of key.
...and most of the time, if you're upgrading from Version 1.0 or 1.1,
Foxhound tells you exactly which kind of key you need.
Enhancement: Timeout Exceptions Replaced by Console Messages
[Top]
Timeout exceptions are very common and usually useless, so they have been replaced by an additional message to the console.
Previously, Foxhound would record an exception that looked like this:
   1184 2012-07-07 11:36:39.163 Full Build 4162a 1000000009 202b1(202eh1) Connection timeout for target DSN ddd12
      after 15.4s (timeout threshold is 15.0s; see Foxhound Options) - 1000004860
while SQL Anywhere would produce a message on the Foxhound server console that looked like this:
I. 07/07 11:36:39. User "DBA" dropped event connection 1000004860 ("rroad_monitor_sample_loop")
The console message from SQL Anywhere can't be suppressed, and it can be confusing because it looks like an error message.
Now, two messages appear on the console, with the one coming from Foxhound helping to explain why SQL Anywhere produced the other message:
   I. 07/07 11:36:39. Connection 1000004860 dropped by Foxhound because it failed to connect to target DSN ddd12
      after 15.4s (timeout threshold is 15.0s; see Foxhound Options)
   I. 07/07 11:36:39. User "DBA" dropped event connection 1000004860 ("rroad_monitor_sample_loop")
Enhancement: New Views And Columns For Adhoc Reporting
[Top]
New views...
CREATE VIEW autodrop_candidate     AS SELECT * FROM rroad_autodrop_candidate;
CREATE VIEW autodropped_connection AS SELECT * FROM rroad_autodropped_connection;
CREATE VIEW message_locator        AS SELECT * FROM rroad_message_locator;
CREATE VIEW schedule               AS SELECT * FROM rroad_schedule;
CREATE VIEW schedule_day_entry     AS SELECT * FROM rroad_schedule_day_entry;
CREATE VIEW schedule_period_entry  AS SELECT * FROM rroad_schedule_period_entry;
New columns...
rroad_group_1_property_pivot.CPU_count                         INTEGER NULL,
rroad_group_1_property_pivot.autodropped_connection_count      INTEGER NOT NULL DEFAULT 0,
rroad_group_2_property_pivot.autodrop_attempt_count            INTEGER NOT NULL DEFAULT 0,
rroad_group_2_property_pivot.autodrop_reason                   LONG VARCHAR NOT NULL DEFAULT '',
rroad_group_2_property_pivot.autodrop_result                   LONG VARCHAR NOT NULL DEFAULT '',
rroad_group_2_property_pivot.ParentConnection                  BIGINT NULL,                                 -- '- - - - - -- -- 12'
rroad_group_2_property_pivot.interval_CPU_percent              DECIMAL ( 30, 1 ) NOT NULL DEFAULT 0, -- old rows will have zero values
Enhancement: More Adhoc Reporting Samples
[Top]
More examples have been added to the adhoc FAQ "How do I run adhoc queries on the Foxhound database?"
http://www.risingroad.com/foxhound/faq/FAQ-How-do-I-run-adhoc-queries-on-the-Foxhound-database.html
Recent blocked connections.
Long-running queries.
Latency and throughput history plus 100-sample moving averages.
Enhancement: Primary Key Values Displayed For Adhoc Reporting And "Go to:" Jumping
[Top]
Two important Foxhound database primary key values, sampling_id and sample_set_number, are now displayed on the Monitor and History pages;
for example, "[4,1796] Recent Sample" and "[4,1796] Samples".
Now it's easier to write adhoc queries that display the same rows that are showing up on the Monitor and History pages.
The sample_set_number values can also be used in the Go to: field on the History menu.
Behavior Change: Rental Edition Replaces Evaluation Edition
[Top]
Foxhound can now be rented for 30 days at a time, giving you all the features of the Basic Edition at a lower price.
The new Rental Edition replaces the Evaluation Edition which is no longer available.
Here are the differences...
See also...
What are the differences among the different editions of Foxhound: Rental, Basic and Extended?
What are the differences among all the activation keys?
Behavior Change: Only Adhoc Reporting Is Available Without Activating Foxhound
[Top]
Previously, the History page was available after the Evaluation period expired; that is no longer true for the new Rental edition.
This change also affects Version 1.0 and 1.1 databases that require a registration key to be upgraded to Version 2.0.
Adhoc reporting is always available, however, and that satisfies the Foxhound promise that you always have access to data that belongs to you.
Behavior Change: The "Display Alerts" Checkbox Has Been Removed.
[Top]
Alert messages are now always displayed on the Monitor and History displays,
and in the Active Alerts section of Foxhound Menu Monitor Tab.
Behavior Change: Data Upgrade Process Not Supported For Pre-Version 1.0 (Beta) Databases.
The Foxhound data upgrade process now only copies data from databases created with the original Foxhound GA version 1.0.3738 and later.
Fixes...
[Top]
Fix: The Active I/Os column has been removed.
The Active I/Os column has been removed from the Monitor and History pages because the SQL Anywhere CurrIO statistic
on which it is based is unreliable for all target servers up to and including version 12.0.1.
When CurrIO becomes reliable the Active I/Os column may be restored.
Fix: Monitor sampling status shown as "...stopping" long after sampling was stopped.
The sampling status is now promptly shown as "Stopped" on the Monitor page after the Stop Sampling button is pressed,
and on the Monitor tab of the Foxhound Menu page after the Stop link is clicked.
Fix: Emails failing because the email address was empty.
Emails are no longer sent if you leave the Email address(es) for Alerts and AutoDrop Notices: field empty
on the Monitor Options page, thus reducing the number of "Email Failure" messages.
Fix: Incorrect "Running for", "Started at xxx Foxhound time" and overall "CPU Time xx% av" display values.
An error was fixed whereby the difference between the target database server system clock time and the Foxhound
system clock time was sometimes ignored (assumed to be zero) when the Foxhound time was earlier (smaller in value).
For example, if the Foxhound time was set to Pacific Standard time (smaller) but the target database server was using
Eastern Standard time (larger), Foxhound would incorrectly assume that all the times reported by the target database
server were using Pacific Standard time.
The error affected the following three values displayed on the Monitor and History pages in the Most Recent Sample
and Top Sample display areas:
Server running time "Running for" and "Was running for" may show a value that's too low; e.g., 0s.
Server start time "Started at xxx Foxhound time" may show a value that is too high, possibly even in the future.
Overall CPU average "xx% av" may show a value that's too high; e.g., 100%.
The underlying problem was that zero was stored in the rroad_group_1_property_pivot.datediff_msec_between_target_and_local
column, which also affected the adhoc query view column sample_detail.datediff_msec_between_target_and_local.
That column value was used for calculating the three display values listed above.
For example, the server start time recorded in the sample_detail.StartTime column
would be treated as if it was three hours later than it actually was; i.e., Foxhound would assume the
target server had been running for three hours less than it actually had, causing the overall average CPU %
to be shown as higher than it should have been. In an extreme case, the "Started at ... Foxhound time" might
show a value in the future (later than the time the corresponding sample was recorded).
Other calculations were not affected because they were based on a different column
rroad_sample_set.datediff_msec_between_target_and_local which contained a correct (negative) value.
This error has been fixed for new samples by allowing negative values to be stored in the
datediff_msec_between_target_and_local columns.
However, samples recorded before upgrading to the fixed version of Foxhound may still contain incorrect zero values.
Fix: Incorrect Time Connected 0s.
An error was fixed whereby the difference between the target database server system clock time and the Foxhound
system clock time ignored (assumed to be zero) when calculating the connection-level time connected.
This error caused incorrect values (e.g., 0s) to be stored in the rroad_group_2_property_pivot.time_connected column and the
corresponding adhoc reporting view column sample_connection.time_connected.
This error has been fixed for new samples by storing the correct values in the time_connected columns.
However, samples recorded before upgrading to the fixed version of Foxhound may still contain incorrect values.
Fix: Bogus Alert #1 when the clock lurches forward.
An error was fixed whereby an Alert #1 (Database unresponsive) was incorrectly issued, followed soon thereafter by an All Clear,
when the system clock on the computer running Foxhound was set forward.
This error has been fixed by checking to see if the current time has changed by 30 seconds or more between successive passes
through the main Foxhound 5-second monitor timing loop, and if it has, skipping the check for Alert #1 until the next sample
is taken.
Fix: Bogus Alert #1 after pressing Start Sampling.
An error was fixed whereby an Alert #1 (Database unresponsive) was incorrectly issued, followed soon thereafter by an All Clear,
immediately after the "Start Sampling" button was pressed after resolving an earlier problem involving a Foxhound limitation;
e.g., "Foxhound Extended edition is required for more than 100 target database connections"
This error has been fixed by correctly recognizing that the earlier problem caused sampling to be stopped, and that the time
spent while sampling was stopped should not be counted towards the threshold for issuing an Alert #1.
Fix: Meaningless message "Multiprogramming level ... different from default 20".
An error was fixed whereby Foxhound would incorrectly display a Database Curiosity message when the multiprogramming
level was different from 20 even though automatic tuning of the multiprogramming level was in effect.
For example, "Multiprogramming level -gn 12 -- different from default 20" should not have been displayed because the
server was continuously changing the value.
This error has been fixed by not checking the multiprogramming level against the default when automatic tuning
of the multiprogramming level is in effect.
Fix: Count of index lookups incorrectly shown as a per-second rate.
A display formatting error was fixed on the Monitor and History pages whereby the number of index lookups was incorrectly shown as
a rate in the Most Recent Sample / Top Sample section rather than a count. For example, it was shown as +24,810/s instead of +24,810.
This error has been fixed by dropping the "/s" from the display.
Fix: Peak Cache Satisfaction "-".
A rounding error was fixed whereby a value of 99.5% and higher would not be recorded in the rroad_peaks.peak_CacheSatisfaction
column. Consequently, drops in the cache satisfaction to as low as 99.5% would appear as "-" on the "Peaks since" line on the
Monitor and History pages.
Note: For cache satisfaction, lower values are regarded as "peaks" rather than higher values.
This error also affected the adhoc reporting view column peaks.peak_CacheSatisfaction.
This error has been fixed by recognizing two decimal digits of precision when checking to see if a new cache satisfaction value
is different from 100% before storing it in the rroad_peaks table and the peaks view.
However, the current value stored in rroad_peaks.peak_CacheSatisfaction will not be affected by samples recorded before upgrading
to the fixed version of Foxhound; i.e., old rows will not be reprocessed, and the "Peaks since" row may continue to hold an incorrect
value until a new sample causes rroad_peaks.peak_CacheSatisfaction to be changed.
Fix: Bogus Temp Space = 32,768G
An error was fixed whereby Foxhound did not take any corrective action when it received invalid CONNECTION_PROPERTY ( 'TempFilePages' )
values such as 4,294,967,281 and 4,294,967,287. These values caused Foxhound to calculate incorrect Temp Space values like 32,768G.
This error has been fixed for new samples by aggressively limiting values received from the target database for this
property value to the range 0 to 4,290,000,000 and setting values outside that range to zero.
However, samples recorded before upgrading to the fixed version of Foxhound may still contain the incorrect value,
and the "Peaks since" row may continue to hold an incorrect value until the "Reset Peaks" button is pressed.
Fix: Bogus LockCount = 4,294,967,295
An error was fixed whereby Foxhound did not take any corrective action when it received the invalid DB_PROPERTY ( 'LockCount' )
value of 4,294,967,295 from the target database. This error caused the incorrect value of 4,294,967,295 to be stored
in the rroad_group_1_property_pivot.LockCount column and the corresponding adhoc reporting view column
of sample_detail.LockCount, as well as the "Peaks since" columns rroad_peaks.peak_LockCount and peaks.peak_LockCount.
This error has been fixed for new samples by aggressively limiting values received from the target database for this
and some other property values to the range 0 to 100,000,000 and setting values outside that range to zero.
However, samples recorded before upgrading to the fixed version of Foxhound may still contain the incorrect value,
and the "Peaks since" row may continue to hold an incorrect value until the "Reset Peaks" button is pressed.
Fix: Bogus Transaction Running Time = 41,170d 15h 13m 40s
An error was fixed whereby an empty value in the connection-level TransactionStartTime property was changed to 1900-01-01
and subsequently treated as a valid value rather "unknown", thus causing a monstrously large Transaction Running Time to be displayed.
This error, and a similar one involving the LastReqTime property, have been fixed so zero is displayed instead of the bogus values.
Fix: Value 46116860613593576000 out of range for destination.
An error was fixed whereby Foxhound did not take any corrective action when it received the invalid PROPERTY ( 'ProcessCPU' )
value of 46,116,860,613,593,576 seconds from the target database. This in turn caused a runtime error "Value 46116860613593576000
out of range for destination" when Foxhound attempted to multiply the value by 1000 to convert seconds to milliseconds.
This error has been fixed for new samples by aggressively limiting values received from the target database for this
and some other property values to the range 0 to 10,000,000,000,000,000 and setting values outside that range to zero.
However, samples recorded before upgrading to the fixed version of Foxhound may still contain the incorrect value,
and the "Peaks since" row may continue to hold an incorrect value until the "Reset Peaks" button is pressed.
In the case of this particular message, one workaround is to restart the target database to stop it from
reporting the bad value.
Fix: Error message "Column 'b' in table 'cp' cannot be NULL"
An error was fixed whereby the Foxhound Monitor would not be able to gather connection-level sample data when
the target database had the ALLOW_NULLS_BY_DEFAULT option set to 'OFF'.
This has now been fixed by explicitly specifying the NULL option on NULLable columns in a LOCAL TEMPORARY table
inside the rroad_connection_properties procedure that is created on the target database by Foxhound.
Fix: No uninteresting connections deleted.
An error was fixed whereby the uninteresting connection purge process stopped deleting
any rows if it fell behind the old sample purge process.
Fix: Redundant "Sampling stopped" messages.
An error was fixed whereby the Monitor process displayed unnecessary "Sampling stopped" messages
immediately after Foxhound was restarted.
Fix: Out-of-order messages.
Errors were fixed whereby messages appeared out of order in the Monitor and History pages.
In once case a "Database server not found at" message would appear between a pair of "Foxhound stopped at"
and "Foxhound stopped" messages, rather than after the "Foxhound stopped" message.
In another case, a successful sample would appear between a pair of "-- Database server not found at --"
and "-- Database server not found --" pair of messages, rather than after the "-- Database server not found --" message.
Fix: Some engine and database-level properties added together; e.g., CacheHits and CacheRead.
An error was fixed whereby certain properties that are now available at both the engine and server level were
being added together. With previous versions of SQL Anywhere, these properties were available at either the
engine or database levels but not both, so it was OK to add them together, but that is no longer the case.
This error has fixed by ensuring that only one of the two properties is used depending on the version of the target database server.
[Top]
See also...
What is Foxhound?
How do I get a copy of Foxhound?
What are the differences among the different editions of Foxhound: Rental, Basic and Extended?
|