|
Question: What is Foxhound?
Answer: Foxhound is two products in one: it is both a database monitor and a schema troubleshooter for
SQL Anywhere.
A database monitor is a computer program that measures the activity of a database management system and
displays those measurements in a meaningful way, so that you can easily see that everything's OK or
quickly learn about problems and threats to performance and availability.
A monitor can also send email alerts when something goes wrong.
A schema troubleshooter is a computer program that performs a static analysis of the tables, columns,
indexes, foreign key relationships and other objects in the database, displays those objects in a way that's
easy to understand and easy to navigate, together with various facts, figures and curiosities which may be
problems that need attention.
Foxhound Features
1. Is my database up?
[next] [top]
The Alerts feature lets you choose which conditions to watch for:
- The database is unavailable,
- the server's using too much CPU,
- there are too many blocked connections,
- the database is running out of disk space,
- and 24 other conditions.
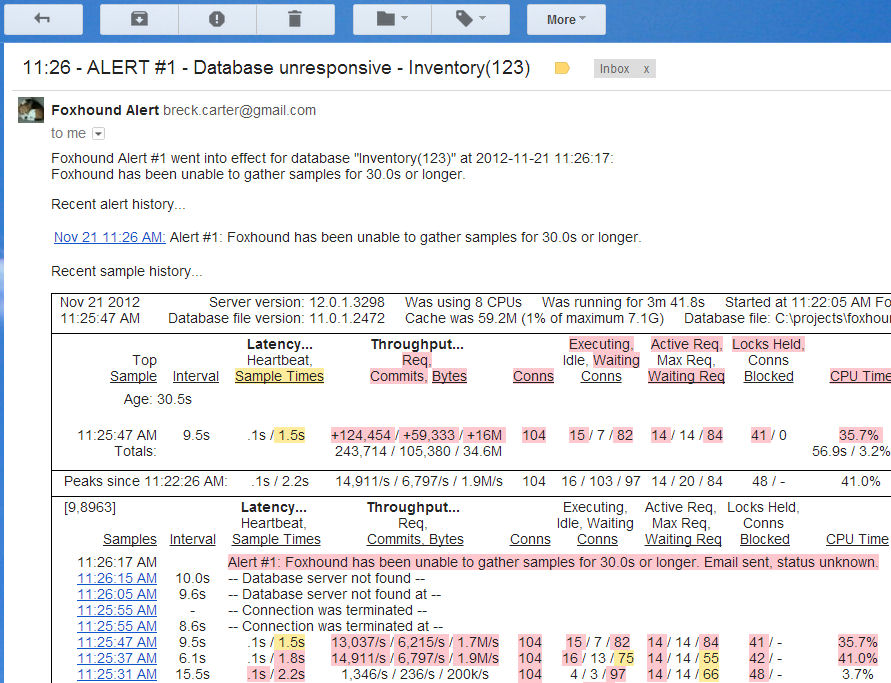
Alert emails include a snapshot of
the data gathered by Foxhound:
(scroll down for more)
|
|
|
2. Is my database OK now?
[next] [top]
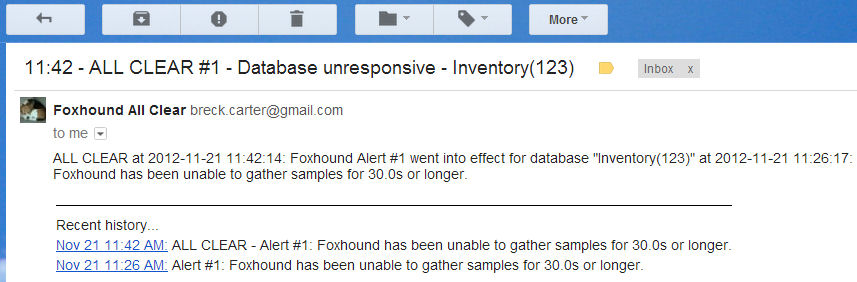
Sometimes an Alert condition goes away by itself, or when someone else resolves the problem.
When that happens you'll get an "All Clear" email telling you to relax.
Only Foxhound has "All Clear" emails!
|
|
|
3. Set your own schedule
[next] [top]
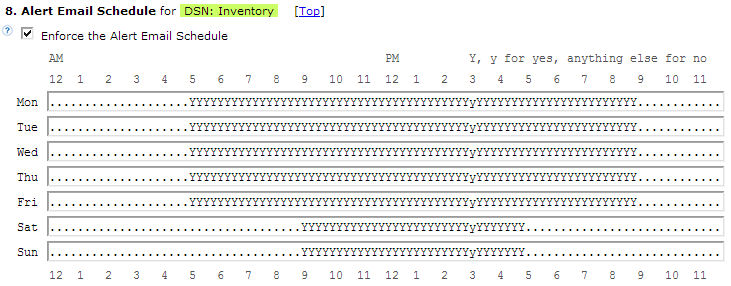
You can set up schedules for
- sending Alert emails,
- collecting samples,
- recording connection-level data, and
- enabling the new AutoDrop feature.
|
|
|
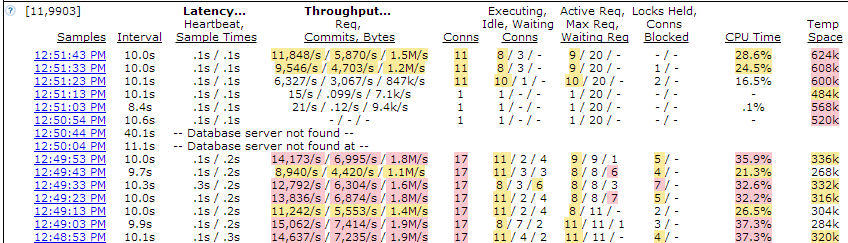
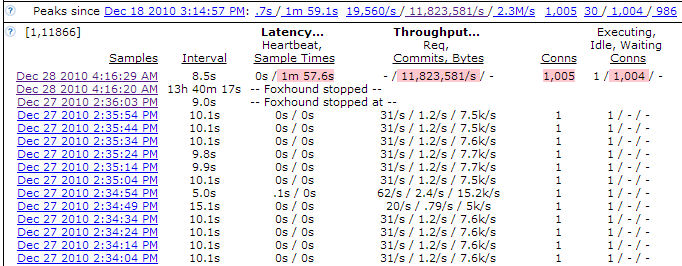
4. See what's happening now
[next] [top]
The Monitor page is automatically refreshed every 10 seconds to show the last 10 samples, plus details of the first 10 connections.
|
|
|
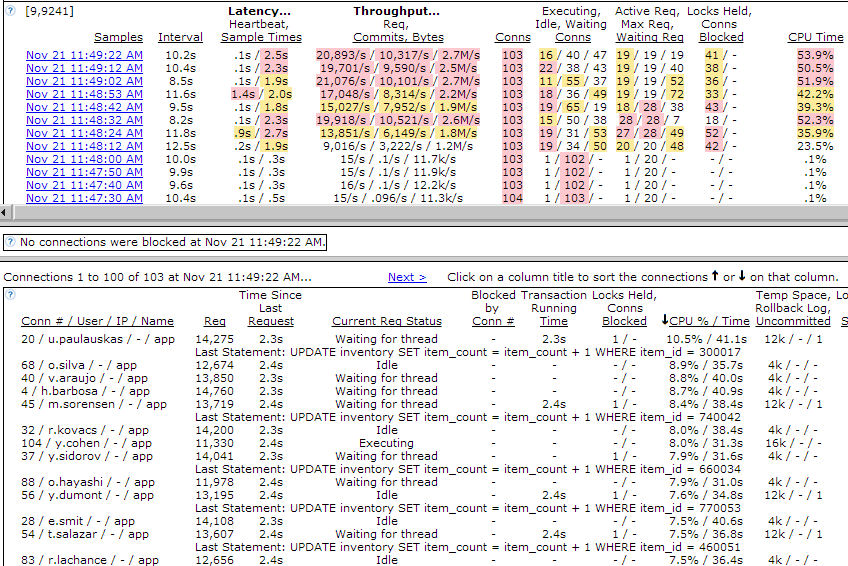
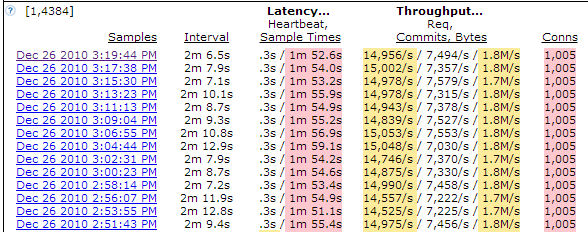
5. See what happened yesterday
[next] [top]
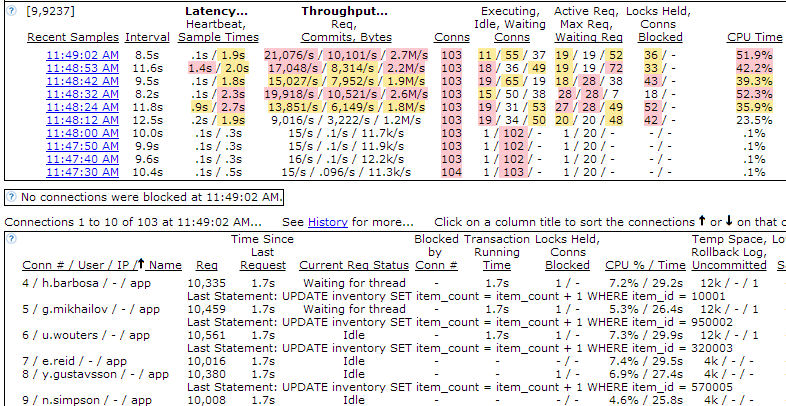
The History page lets you scroll through all the old samples and all the connections for each sample.
Connections can be sorted on
any of the columns.
Here, the connections using the
most CPU % are at the top:
|
|
|
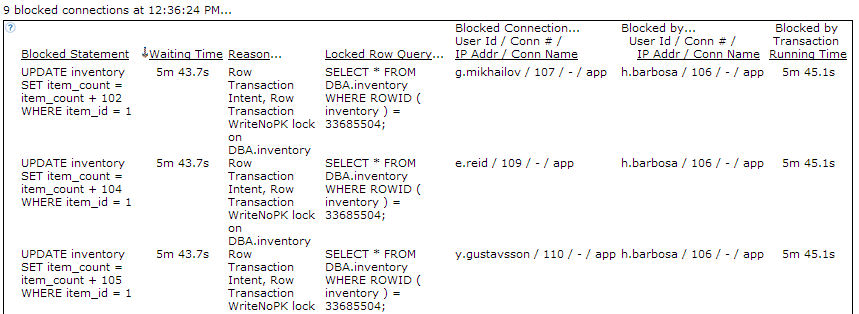
6. See blocked connections
[next] [top]
Foxhound answers all your questions:
- Who's blocked?
- What are they waiting for?
- How long have they been waiting?
- Who's holding the locks?
- What kind of locks are they?
- What tables?
- What rows?
- How long has it been since they last did a commit?
|
|
|
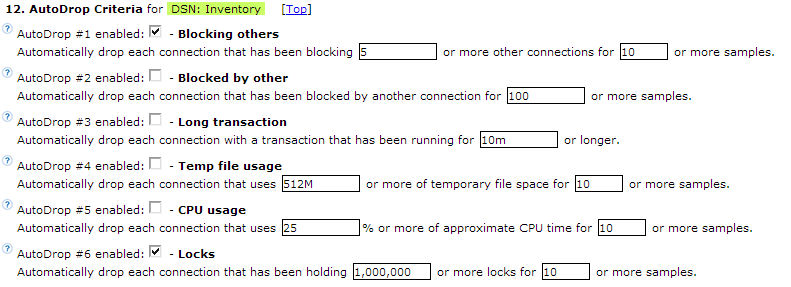
7. AutoDrop runaway connections
[next] [top]
The new AutoDrop feature, which can be turned on
and off with its own schedule, lets you pick from
up to 6 different reasons to automatically drop runaway connections.
|
|
|
8. Persistent connections
[next] [top]
The monitor stays connected to the target database 24x7, and it automatically re-connects
after an outage even when Foxhound itself is shut down and restarted.
|
|
|
9. Persistent data
[next] [top]
The monitor data is preserved in the Foxhound database as long as you want, all instantly available in the History view.
|
|
|
10. Peak highlighting
[next] [top]
Peak values are displayed as links into the History view, and values that reach 80% or 50% of the peaks are color highlighted.
|
|
|
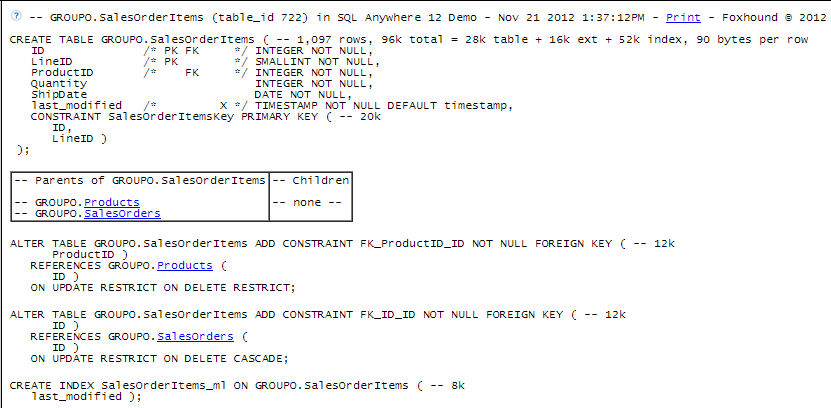
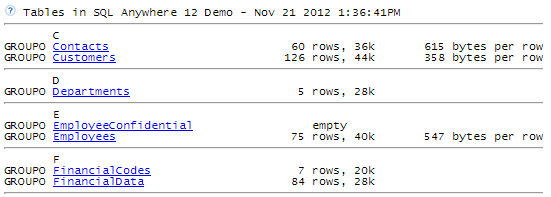
11. Schema at-a-glance
[next] [top]
Each table is shown as a formatted CREATE TABLE statements with all the information a developer needs:
- datatypes,
- defaults,
- constraints,
- indexes and
- relationships,
- all syntactically correct for copy and paste and
- up to date at the time of display.
|
|
|
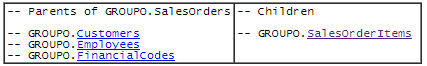
12. Follow the foreign keys
[next] [top]
You can reach each parent and child with a single click: no more "following the lines" on a wall-size diagram.
|
|
|
13. How much space?
[next] [top]
For each table you see how much disk space is used for data, extension pages, keys and indexes.
Bytes-per-row numbers include free space so they can be used to calculate future requirements.
|
|
|
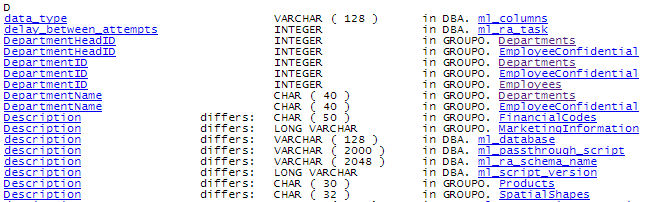
14. Find those columns
[next] [top]
All the column names appear in one alphabetic list with hypertext links into the table and view definitions.
Plus, you can see at a glance where different data types are used for the same column name in different tables.
|
|
|
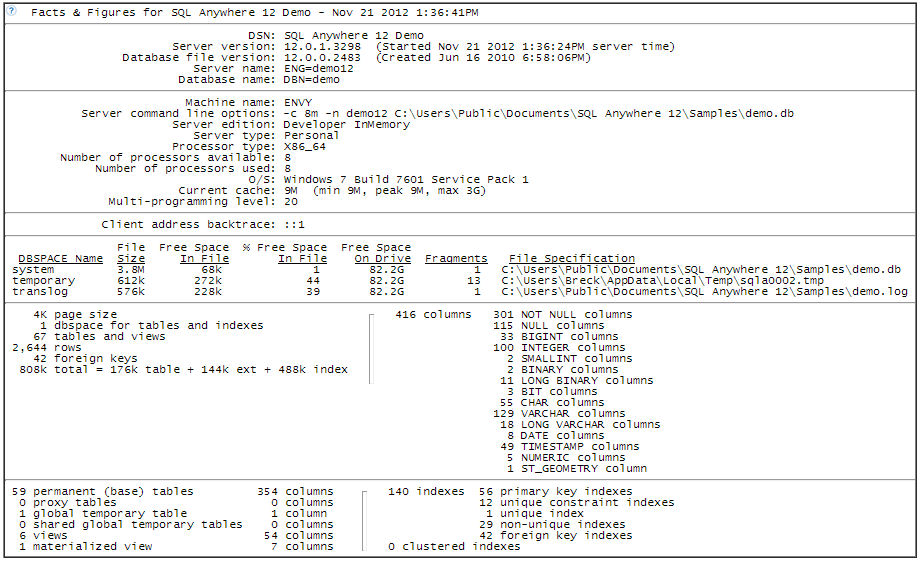
15. Facts & Figures
[next] [top]
This page tells you all the names your database goes by: DSN, server, database and machine.
It also tells you where all your database files are located, how much free space they contain, and how badly each file is fragmented.
Plus, it tells you how big your database is: how many rows, how many bytes, how many tables, columns, indexes, even how many times each different data type is used.
|
|
|
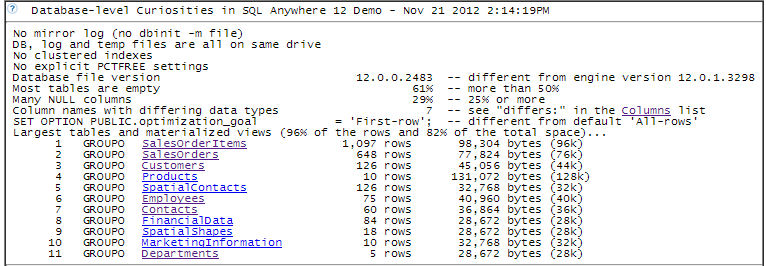
16. What's unusual about this database?
[next] [top]
A "curiosity" is an interesting fact; it may or may not be a problem.
If there's something unusual about your database,
you'll see it at a glance in the "Database Curiosities" section.
|
|
|
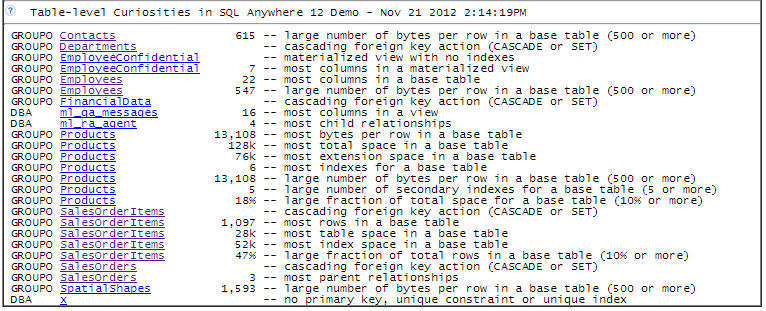
17. What's unusual about this table?
[top]
The Table-level Curiosities section shows dozens of interesting facts about individual tables; e.g.,
no primary key, most bytes per row, large number of secondary indexes, and large amount of index space
relative to table space,
|
|
See also...
How do I get a copy of Foxhound?
What are the differences among the different editions of Foxhound: Rental, Basic and Extended?
What are the Foxhound system requirements?
What's new in Foxhound 2.0?
What is SQL Anywhere?
Help - Introduction - Foxhound Design Decisions
Help - Introduction - Foxhound Highlights
|