*better: More thorough, more relevant, more effective.
...more Alerts, more All Clears, more details, more control in your hands.

|
Foxhound is the better* Database Monitor for SQL Anywhere.
*better: More thorough, more relevant, more effective.
...more Alerts, more All Clears, more details, more control in your hands.
|
Breck Carter
Last modified: May 7, 1996
mail to: bcarter@bcarter.com
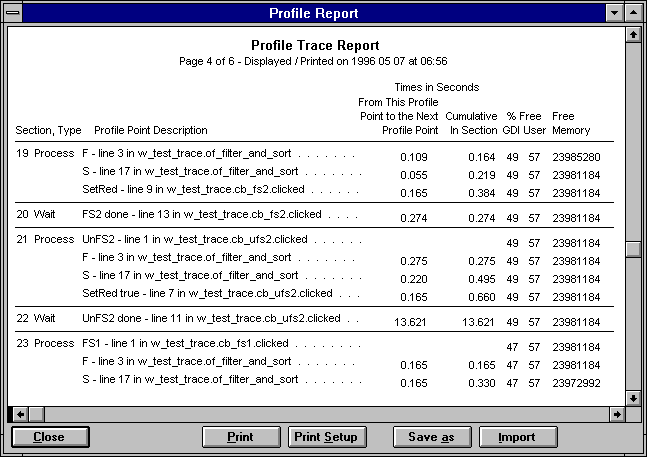
The code for A Rudimentary Execution Profiler has been improved to include the Profiler Feedback as well as new columns for "% Free GDI", "% Free User" and "Free Memory".
Click here to download profcode.zip.
Here's what the new Profile Trace Report looks like:

Setup is described in the documentation() function contained in the w_prof_trace window in proftrac.pbl.
The "Full Feature Setup" is recommended:
/*

Documentation() Function in W_Prof_Trace
----------------------------------------

Contents: Running the "Minimum Setup Test" Program ProfMinT
          Running the "Full Setup Test" Program ProfTest
          Minimum Setup For Your Program
          Full Feature Setup For Your Program (Recommended)
          Notes

========================================================

Running the "Minimum Setup Test" Program ProfMinT

(1) Open the testmint application object in profmint.pbl.
    Make sure the application library list contains both
    profmint.pbl and proftrac.pbl.

(2) Run the application. It will connect to the PowerBuilder 4
    "Powersoft Demo DB" as follows:

      SQLCA.DBMS = "ODB"
      SQLCA.DBParm = "ConnectString=" &
         + "'DSN=Powersoft Demo DB;" &
         + "UID=DBA;PWD=SQL'"
      connect using SQLCA;

(3) The Profile Trace window will show all figures in one
    "section" with no way to tell the difference between time
    spent executing code and time spent waiting for user input.
    This is OK for some applications but most people will want
    to take advantage of the "Full Setup" features.

========================================================

Running the "Full Setup Test" Program ProfTest

(1) Open the testprof application object in proftest.pbl.
    Make sure the application library list contains both
    proftest.pbl and proftrac.pbl.

(2) Run the application. It will connect to the PowerBuilder 4
    "Powersoft Demo DB" as follows:

      SQLCA.DBMS = "ODB"
      SQLCA.DBParm = "ConnectString=" &
         + "'DSN=Powersoft Demo DB;" &
         + "UID=DBA;PWD=SQL'"
      connect using SQLCA;

(3) The Profile Trace window will show different "sections"
    for time spent executing code and time spent waiting for
    user input.

========================================================

Minimum Setup For Your Program:

(1) Include proftrac.pbl in your library search list.
    Note that profmint.pbl and proftest.pbl are for
    demonstration purposes only; you do not need to
    include them in your library search list.

(2) Declare the following global variable:

      uerr_error_trace guo_error_trace

(3) Add the following to the application open script:

      guo_error_trace = create uerr_error_trace

(4) Add the following to the application close script:

      destroy guo_error_trace

(5) Call f_prof_point at various points in your scripts:

      f_prof_point ( "descriptive text" )

    Make the descriptive text different for each call
    because that's the only way you'll be able to relate
    lines in the profile report back to your code.

(6) Run your application; the Profile Trace window will
    appear automatically.

========================================================

Full Feature Setup For Your Program (Recommended):

(1) Include proftrac.pbl in your library search list.
    Note that profmint.pbl and proftest.pbl are for
    demonstration purposes only; you do not need to
    include them in your library search list.

(2) Declare the following global variables:

      uerr_error_trace guo_error_trace
      u_cc_prof_error g

(3) Add the following to the application open script:

      guo_error_trace = create uerr_error_trace

(4) Add the following to the application close script:

      destroy guo_error_trace

(5) Replace the application SystemError script with this code:

      guo_error_trace.number  = error.number
      guo_error_trace.text    = error.text
      guo_error_trace.WindowMenu = error.WindowMenu
      guo_error_trace.object  = error.object
      guo_error_trace.ObjectEvent = error.ObjectEvent
      guo_error_trace.line    = error.line

(6) Add g.i++ statements and calls to f_prof_xxx functions at
    various points in your scripts. The g.i++ statements force
    SystemError events that are trapped by the profiler to
    determine the current location in the script. The three
    different f_prof_xxx functions are described below:

      // Call f_prof_wait when the program is about to enter
      // a "wait for user input" state; e.g. at the end of a
      // window open script:

      g.i++ ; f_prof_wait ( "descriptive text" )

      // Call f_prof_section when you want a new "section" to
      // appear in the profile output:

      g.i++ ; f_prof_section ( "descriptive text" )

      // Otherwise, call f_prof_point:

      g.i++ ; f_prof_point ( "descriptive text" )

    The descriptive text does not have to be unique because
    with the full setup, the profile report automatically
    includes script names and line numbers.

(7) Run your application; the Profile Trace window will
    appear automatically.

========================================================

Notes:

(1) The following Windows 3.x API functions are declared
    in this object as Local External Functions. You may
    have to use different functions with other versions
    of Windows:

      function UnsignedInteger GetFreeSystemResources &
         ( UnsignedInteger al_resource ) library "user.exe"

      function ulong GetFreeSpace &
         ( UnsignedInteger aui_dummy ) library "kernel.exe"

(2) This Window consumes memory as more entries are added
    to the DataWindow, so you will see the "Free Memory"
    value drop slowly as you run your program. Although it
    does not affect the "GDI" and "User" values, this behaviour
    makes it difficult to track down "Free Memory" leaks in
    your code.

    You may wish to declare and call GetFreeSpace() from your
    program rather than use the profiler:

      long ll_memory
      ll_memory = GetFreeSpace ( 0 )

(3) Do not put too many f_prof_xxx() calls in your program.
    In particular, do not try to get timing figures for
    individual fast-running statements like li_integer++
    because they will not be accurate (this warning does not
    apply to long-running statements like connect or retrieve.)

    If you are trying to compare two different ways of coding
    an individual fast-running statement, code three loops and
    time the loops as a whole. The first loop should be empty
    to give the "overhead" loop execution time. The other two
    loops should contain your two alternatives:


      g.i++ ; f_prof_section ( "Empty loop" )
      for li_counter = 1 to 10000
      next

      g.i++ ; f_prof_section ( "Test 1" )
      for li_counter = 1 to 10000
         ...alternative 1 statement
      next

      g.i++ ; f_prof_section ( "Test 2" )
      for li_counter = 1 to 10000
         ...alternative 2 statement
      next

      g.i++ ; f_prof_section ( "Done" )

    Do not put f_prof_xxx() calls inside tight loops
    because the Profile Report will grow so large as to
    to be useless.

*/
Breck Carter can be reached by phone at (416) 763-5200 or via email at bcarter@bcarter.com.